Why Invest in Sysmex
Here we present key information on Sysmex’s growth potential and shareholder returns in an accessible way.
Ⅰ. About Sysmex
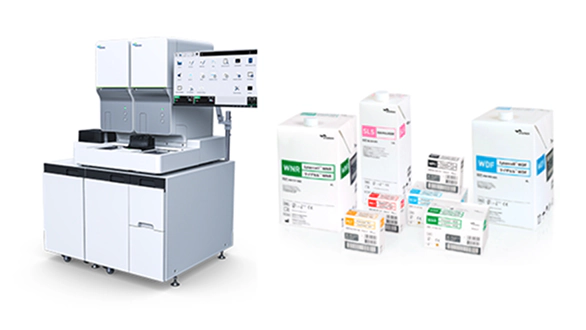
Since its founding in 1968, Sysmex has primarily operated the field of in vitro diagnostics using blood and urine samples, and supporting the health of people around the world.
Our products and services are distributed to over 190 countries and regions through our directly owned value chain encompassing R&D, production, sales, and customer care.
We have also been expanding our business activities to include robotic-assisted surgery systems to address a wider range of medical needs.
- *As of the end of March 2026


(our estimate)


A common type of blood test that checks red blood cells, white blood cells, and platelet counts, and screens for abnormalities
Ⅱ. How Sysmex maintains its global leading share
Our competitive advantage, built on the synergies of three core capabilities, makes us our customers’ number one choice.
For seven to eight years following the sale of instruments, we continue to provide reagents and customer care to secure stable revenue.
Leveraging our unique strength in the integrated development of instruments, reagents, and IT, we create new testing technologies to deliver highly accurate test data. We develop products that comply with local needs and regulations.

Our global network of medical institutions allows us to establish sales frameworks that meet local needs. Our customer care framework ensures uninterrupted testing and stable operation of testing laboratories.

- *As of the end of March 2026
Ⅲ. Sysmex’s Track Record
We continuously expand the potential and growth of healthcare by providing products and services that meet evolving needs while staying ahead of market dynamics.
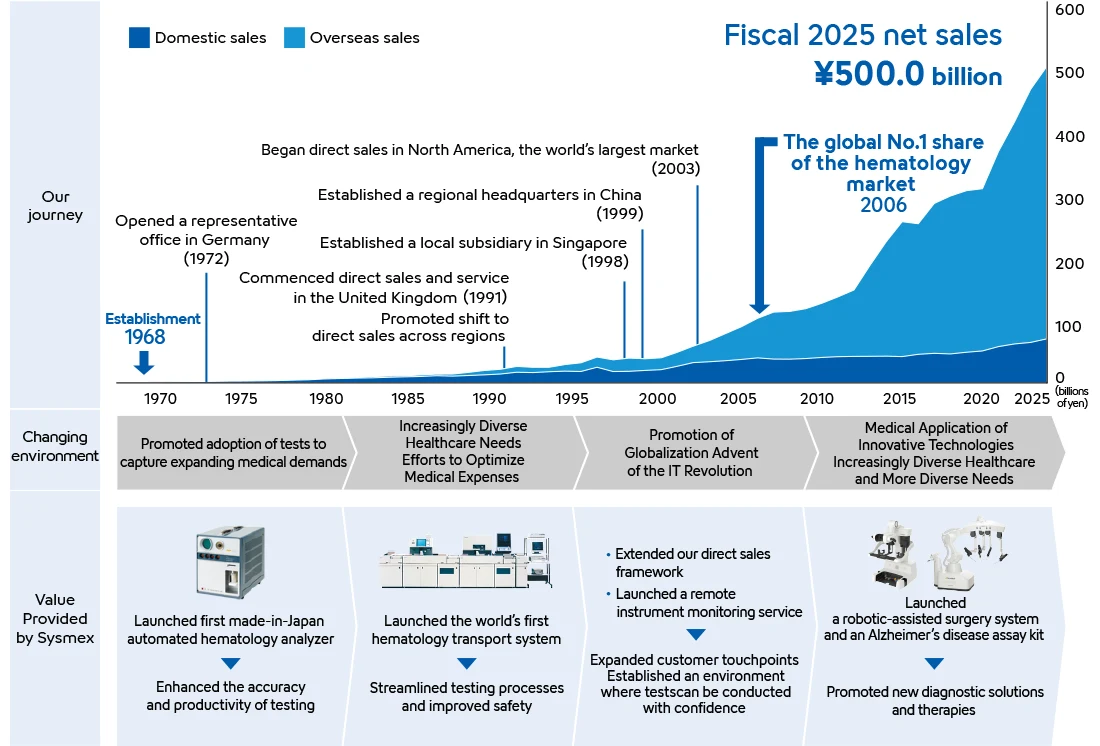
- *Years shown in this graph refer to fiscal years (April through March of the following year).
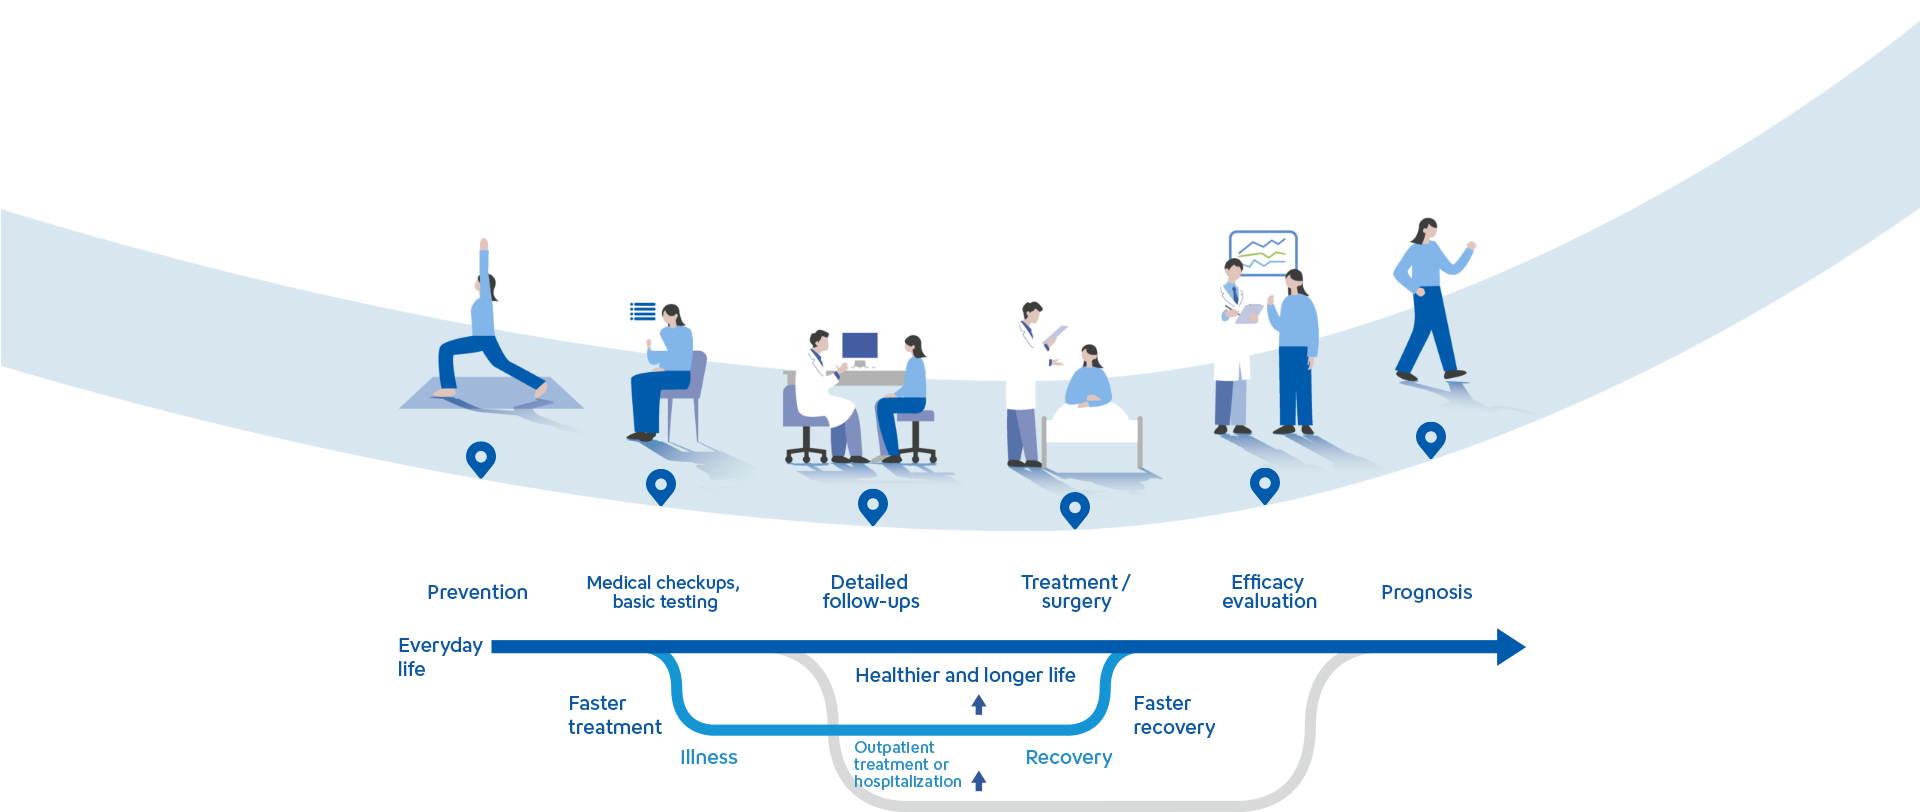
Ⅳ. Sysmex’s Long-term Vision: Together for a better healthcare journey
We are committed to improving lifetime healthcare, or the “healthcare journey,” to extend healthy lifespans throughout society.
Ⅴ. Performance Trend
Fiscal year ending March 31, 2026
Trend in net sales/operating income
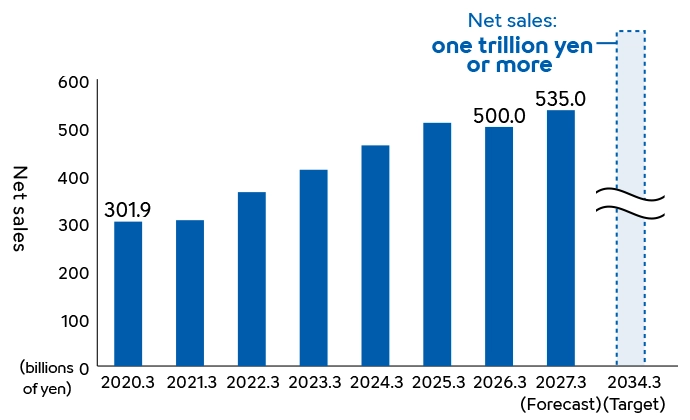
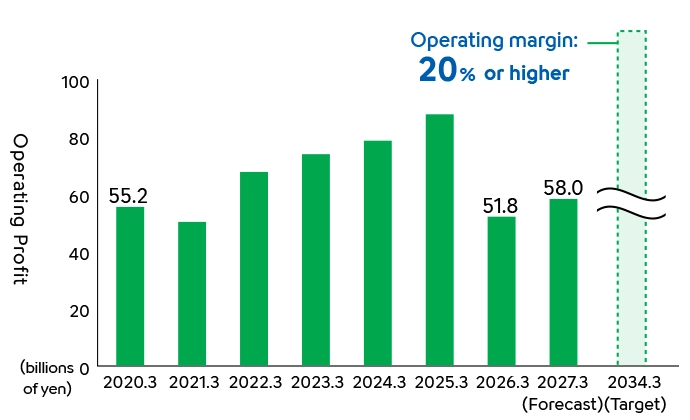
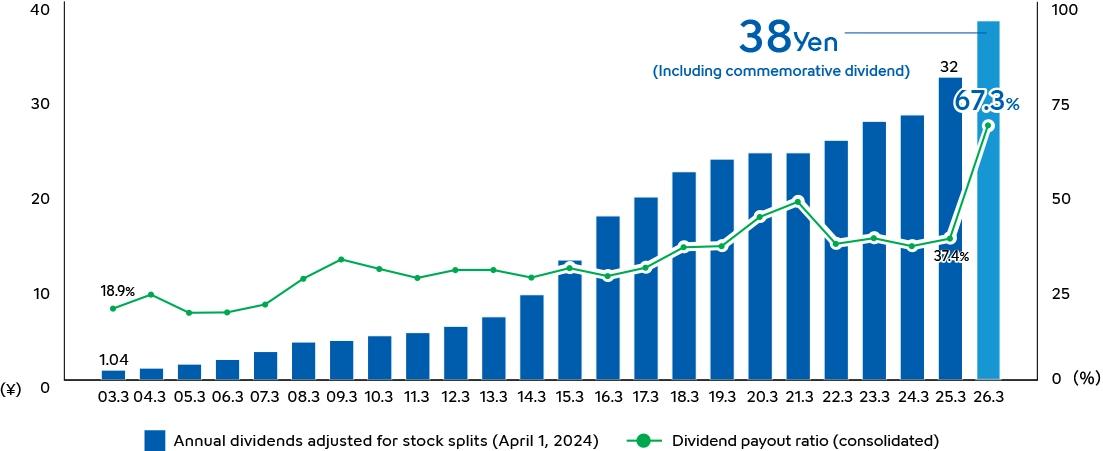
Ⅵ. Shareholder returns, Dividends
Our basic shareholder return policy emphasizes continuous and stable dividend distribution as well as performance-based returns. In line with this policy, we aim to implement progressive dividends with a consolidated dividend payout ratio of approximately 40%.
Annual dividends
Trends in dividend/payout ratio