Financial Information
Key Management Indicators
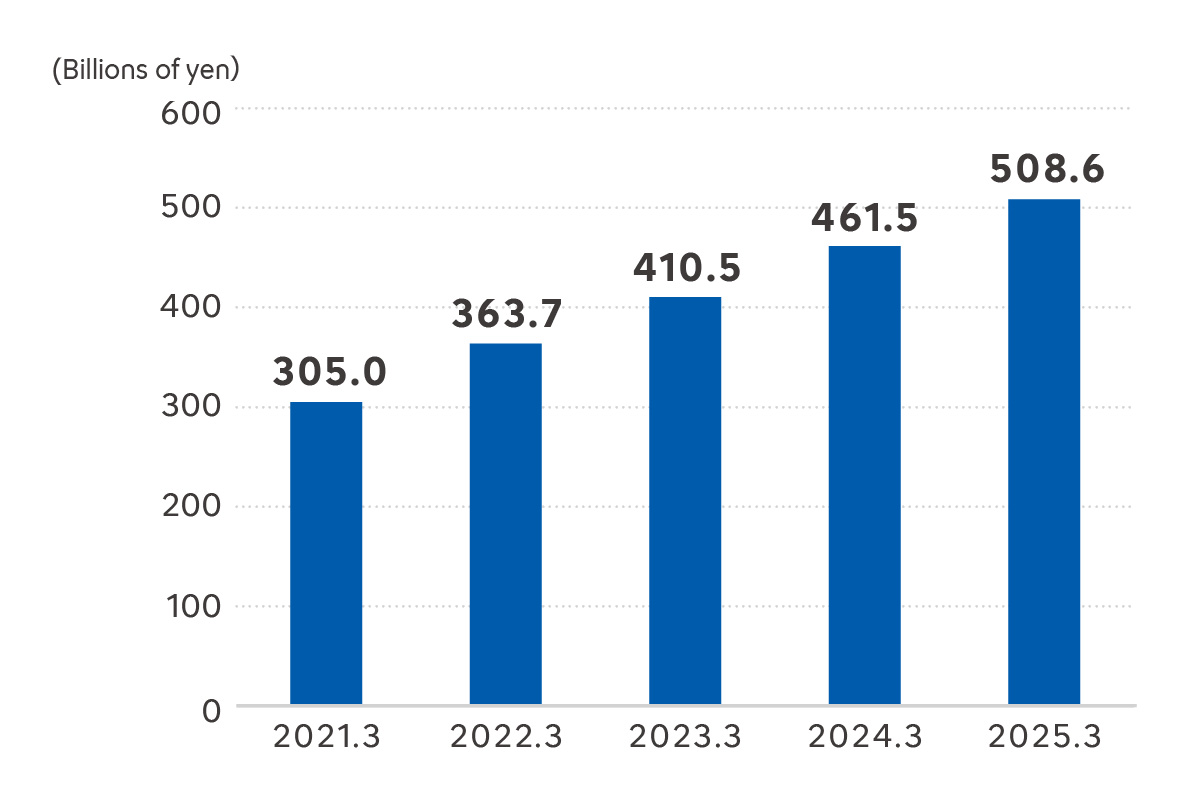
Net Sales
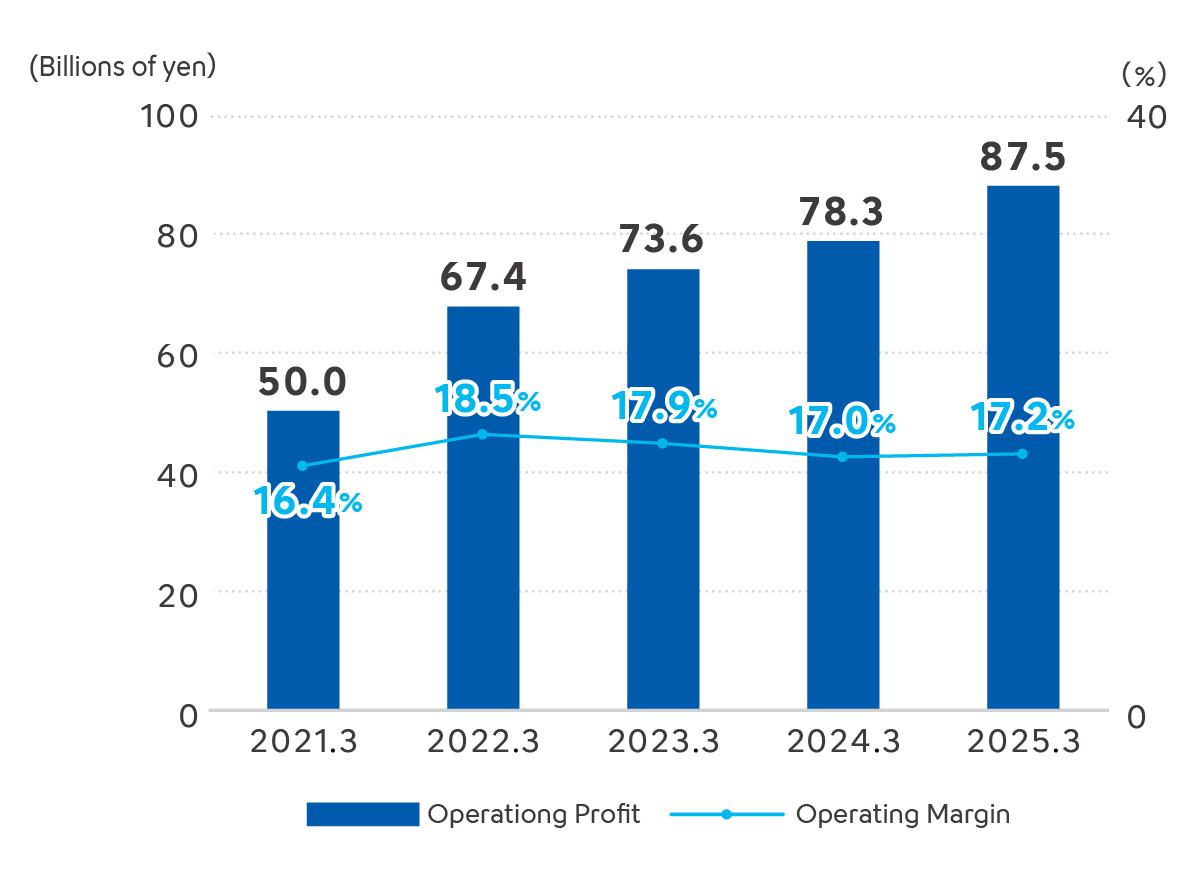
Operationg Profit ・ Operating Margin
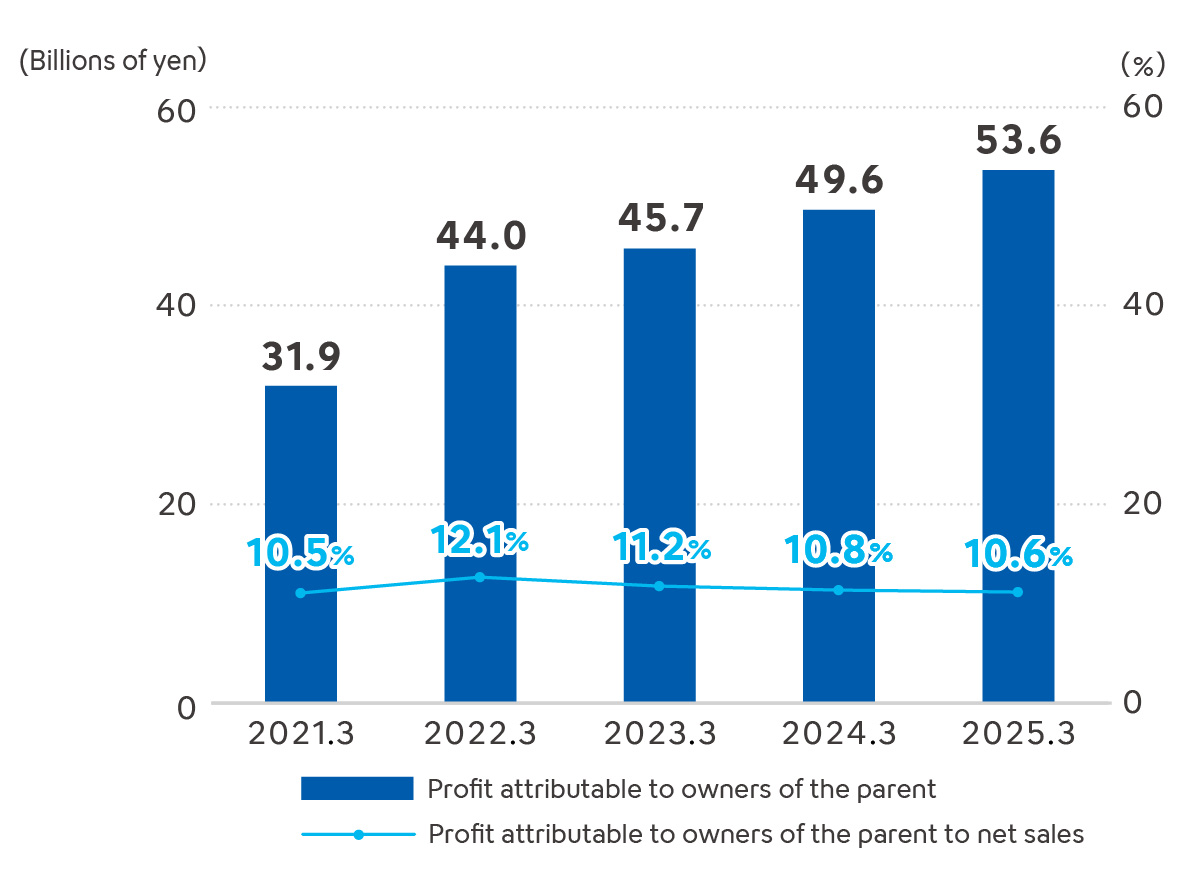
Profit attributable to owners of the parent
Profit attributable to owners of the parent to net sales
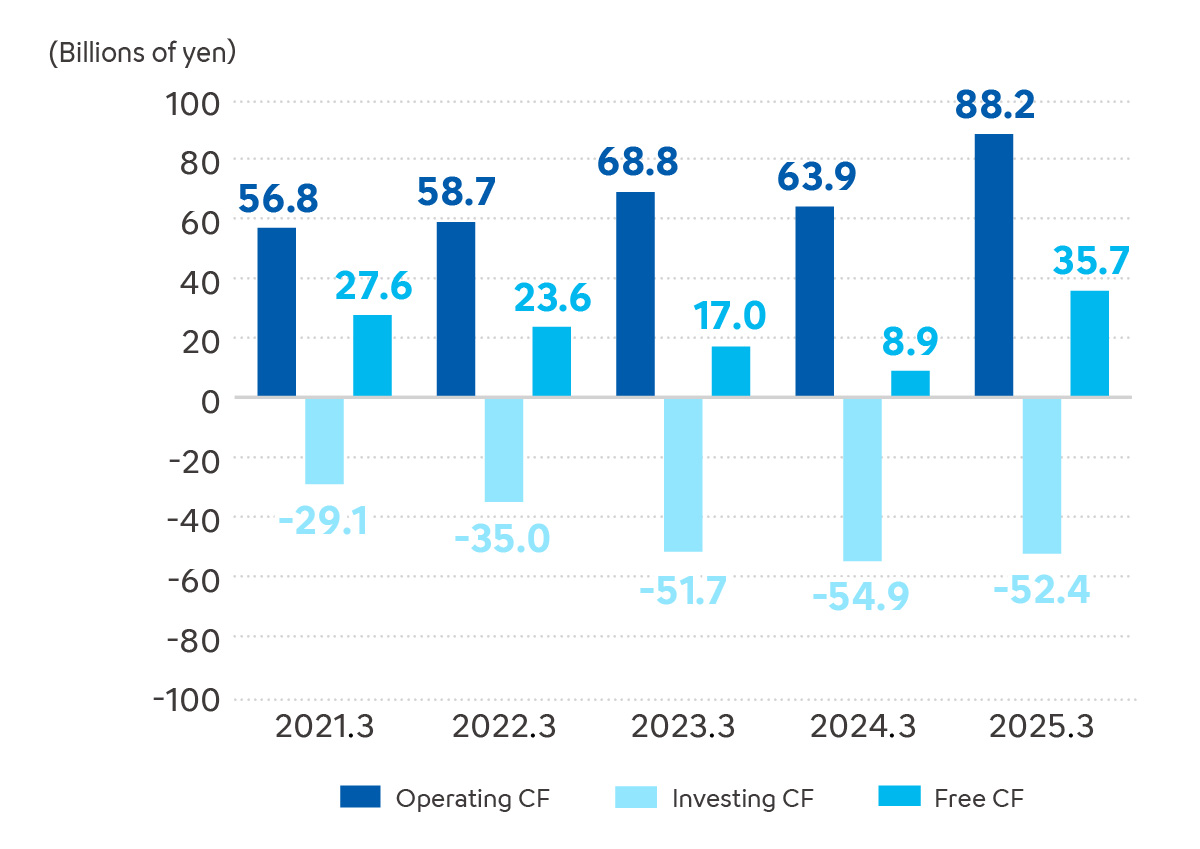
Cash Flows
ROE ・ ROA
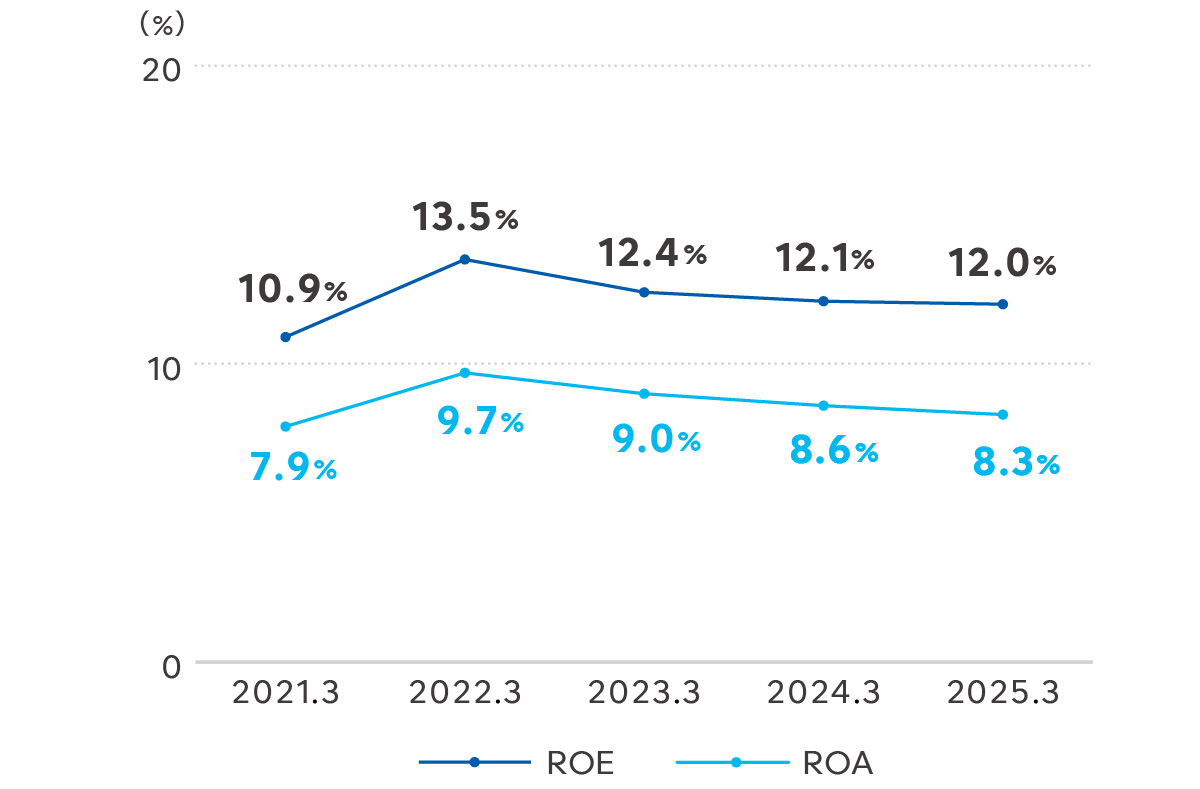
ROA = Profit attributable to owners of the parent/total assets (yearly average)×100
Other Management Indicators
| Item | 2021.3 | 2022.3 | 2023.3 | 2024.3 | 2025.3 |
|---|---|---|---|---|---|
| Total assets (billion yen) |
424.8 | 483.7 | 531.0 | 618.9 | 665.2 |
| Total equity (billion yen) |
306.0 | 349.0 | 388.3 | 432.8 | 464.5 |
|
Diluted earnings per share
(yen) |
50.82 | 70.16 | 72.91 | 79.24 | 86.05 |
| Equity attributable to owners of the parent per share (yen) | 486.96 | 554.94 | 617.56 | 692.94 | 745.71 |
Note:
A three-for-one stock split was conducted for shares of common stock on April 1, 2024. Diluted earnings per share and equity attributable to owners of the parent per share for the fiscal year ending March 2024 and prior years have been calculated as if the stock split had taken place at the beginning of the previous consolidated fiscal year.
