Environmental Data
| INPUT | |||
|---|---|---|---|
| Fiscal | 2022 | 2023 | 2024 |
| Electricity (MWh) | 54,466 | 52,965 | 55,218 |
| City gas (thousand m3) | 1,585 | 1,415 | 1,416 |
| LPG (t) | 17 | 15 | 11 |
| LNG (t) | 0 | 0 | 0 |
| Heavy oil (kL) | 0 | 0 | 0 |
| Kerosene (kL) | 1 | 1 | 1 |
| Diesel oil (kL) | 19 | 19 | 19 |
| Gasoline for fleet in Japan (kL) | 3,116 | 3,432 | 3,674 |
| Diesel for fleet in Japan (kL) | 1,200 | 1,172 | 782 |
| Water use volume (thousand m3) | 501 | 542 | 558 |
| Office paper (t) | 34 | 22 | 23 |
| PRTR (t) | 0 | 0 | 0 |
 | |||
| OUTPUT | |||
Fiscal | 2022 | 2023 | 2024 |
| Greenhouse gas emissions (Scope 1) (t-CO2) | 13,986 | 13,925 | 13,449 |
| Greenhouse gas emissions (Scope 2) (t-CO2) | 15,200 | 6,706 | 6,183 |
| Greenhouse gas emissions (Scope 3) (t-CO2) | 587,575 | 564,191 | 581,743 |
| Waste emissions (t) | 3,682 | 2,832 | 3,040 |
| Recycling rate (%) | 80 | 80 | 81 |
| Wastewater volume (thousand m3) | 303 | 254 | 292 |
| PRTR (t) | 0 | 0 | 0 |
| Item | Content | Unit | Fiscal | Calculation Method and Other Note | |||||||
|---|---|---|---|---|---|---|---|---|---|---|---|
| 2020 | 2021 | 2022 | 2023 | 2024 | 2024 Coverage*1 | ||||||
| INPUT | Energy consumption | Consumption of non-renewable energy | Electricity (non-renewable) | MWh | 42,287 | 42,970 | 45,778 | 16,787 | 15,574 | 99%*2 | ― |
| City gas | 1,000 m3 | 1,212 | 1,238 | 1,585 | 1,415 | 1,416 | ― | ||||
| LPG | t | 16 | 19 | 17 | 15 | 11 | ― | ||||
| LNG | t | 0 | 0 | 0 | 0 | 0 | ― | ||||
| Heavy oil | kL | 0 | 0 | 0 | 0 | 0 | ― | ||||
| Kerosene | kL | 1 | 1 | 1 | 1 | 1 | ― | ||||
| Diesel oil | kL | 13 | 0 | 19 | 19 | 19 | ― | ||||
| Consumption of renewable energy | Electricity (renewable) | MWh | 5,871 | 6,085 | 8,688 | 36,178 | 39,644 | ― | |||
| Consumption of other non-renewable energy | Gasoline (fleet) | kL | 518 | 502 | 3,116 | 3,432 | 3,674 | ― | |||
| Diesel oil (fleet) | 10 | 8 | 1,200 | 1,172 | 782 | ― | |||||
| Total consumption (non-renewable energy) | MWh | 137,723 | 139,661 | 188,850 | 153,747 | 153,265 | |||||
| Total consumption | GJ | 516,936 | 524,686 | 711,139 | 683,731 | 694,470 | Total consumption = Σ (consumption by energy type × conversion factor*3) | ||||
| Water use volume | Groundwater | 1,000 m3 | 86 | 96 | 90 | 103 | 130 | 83% | ― | ||
| Purchased water | 366 | 391 | 410 | 439 | 428 | ― | |||||
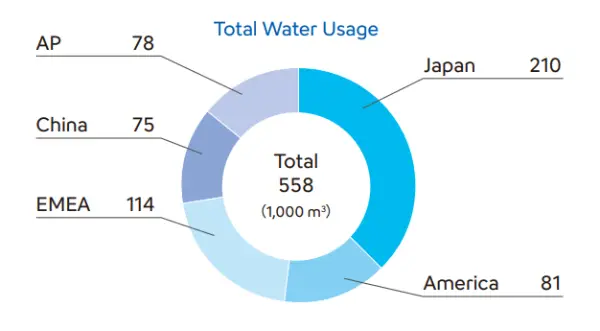
| Total volume | 452 | 487 | 501 | 542 | 558 | ― | |||||
| Amount of office paper used | t | 30 | 28 | 34 | 22 | 23 | 27% | ― | |||
| PRTR input | t | 0 | 0 | 0 | 0 | 0 | 38% | The amount of PRTR substances handled at business sites that handle chemicals in Japan | |||
| OUTPUT | Greenhouse gas emissions Scope 1 | CO2 emissions of energy consumption from stationary combustion sources | t-CO2 | 2,807 | 2,836 | 3,649 | 2,994 | 2,987 | 99%*2 | Emissions = Σ (fuel consumption × CO2 emission factor*3 ) | |
| CO2 emissions from fleet | 1,227 | 1,187 | 10,337 | 10,931 | 10,462 | ||||||
| Total emissions | 4,034 | 4,023 | 13,986 | 13,925 | 13,449 | ||||||
| Greenhouse gas emissions Scope 2 | Total emissions | t-CO2 | 15,476 | 15,901 | 15,200 | 6,706 | 6,183 | Emissions = Σ (purchased electricity consumption × CO2 emission factor*4 )+ Σ (purchased steam consumption × CO2 emission factor*3 ) | |||
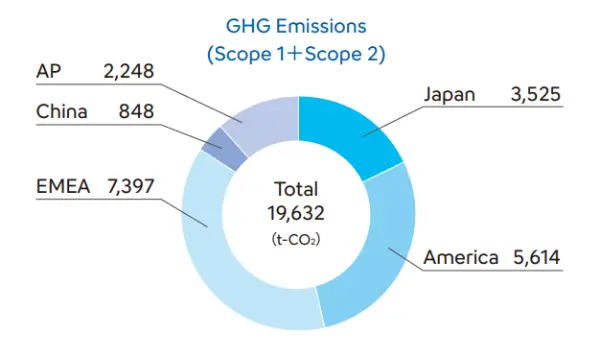
| Scopes 1 + 2 | Total emissions | t-CO2 | 19,510 | 19,924 | 29,186 | 20,632 | 19,632 | ― | |||
| Greenhouse gas emissions Scope 3 | Total emissions | t-CO2 | ― | ― | 587,575 | 564,191 | 581,743 | ― | ― | ||
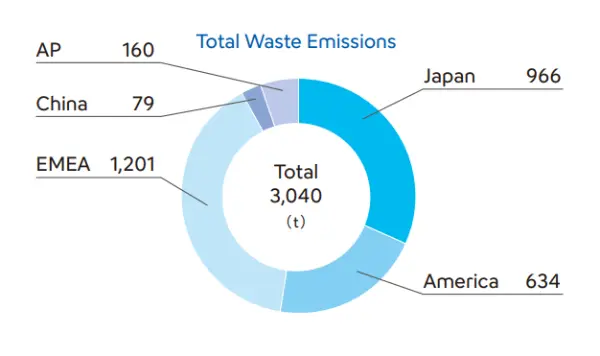
| Waste emissions | Total emissions | t | 2,529 | 2,796 | 3,682 | 2,832 | 3,040 | 90% | Waste emissions = general waste emissions + industrial waste emissions | ||
| Total emissions (excluding sales offices in Japan) | t | 2,411 | 2,689 | 3,537 | 2,690 | 2,941 | 84% | ― | |||
| Waste used for material recycling | 1,711 | 1,929 | 2,445 | 1,777 | 1,880 | Amount of waste converted into valuables as a result of a third-party process. Includes waste converted into fuel (such as RPF) | |||||
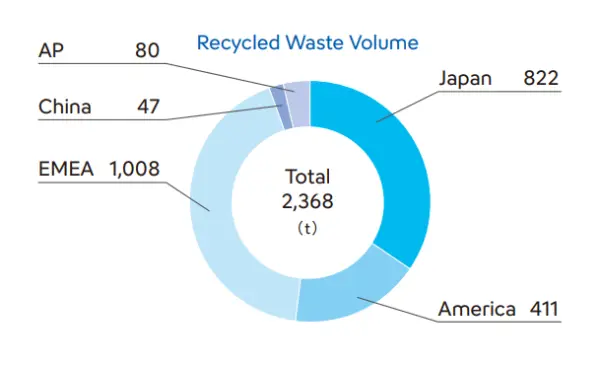
| Recycled waste (including energy recovery) | 1,884 | 2,130 | 2,838 | 2,145 | 2,368 | Amount of waste reused, used for material recycling, or used for energy recovery (thermal recycling) | |||||
| Total amount of waste disposal | 527 | 559 | 699 | 545 | 572 | Total amount of waste disposal = total emissions - recycled waste (including energy recovery) | |||||
| Material recycling rate | % | 71 | 72 | 69 | 66 | 64 | ― | ||||
| Recycling rate (including energy recovery) | 78 | 79 | 80 | 80 | 81 | ― | |||||
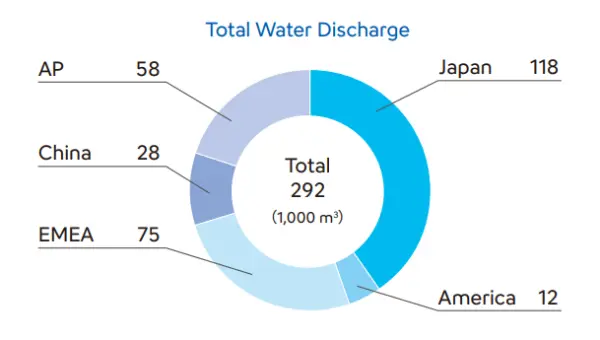
| Wastewater volume | Total emissions | 1,000 m3 | 270 | 273 | 303 | 254 | 292 | 83% | ― | ||
| PRTR output | Emissions | t | 0 | 0 | 0 | 0 | 0 | 38% | Amount of PRTR emitted from business sites that handle chemicals in Japan | ||
| Transfers | 0 | 0 | 0 | 0 | 0 | Amount of PRTR transferred from business sites that handle chemicals in Japan | |||||
| Compliance | Violations of environmental regulations (e.g., air and water pollution) | Total amount of large fines | 100 million yen | 0 | 0 | 0 | 0 | 100% | |||
| Number of sanctions other than fines | Cases | 0 | 0 | 0 | 0 | ||||||
| Significant spills and losses of chemical substances | Total number of cases | Cases | 0 | 0 | 0 | 0 | |||||
| Total leakage volume | t | 0 | 0 | 0 | 0 | ||||||
- *1Coverage is calculated based on the number of employees.
- *2The boundary of GHG emissions for entities consolidated under the financial control criterion.
- *3Conversion factors and emission factors are based on the “Act on Promotion of Global Warming Countermeasures”.
- *4Japan: Adjusted emission factors from the list of emission factors for each electric power company released in accordance with the “Act on Promotion of Global Warming Countermeasures” (For submission in 2025) Other countries: 2021 emission factors from the IEA Emission Factors 2023, IEA
| Scope3 | Unit | Fiscal | ||
|---|---|---|---|---|
| 2022 | 2023 | 2024 | ||
| Category 1: Purchased goods and services | t-CO2 | 202,046 | 190,948 | 219,743 |
| Category 2: Capital goods | t-CO2 | 103,273 | 124,569 | 118,261 |
| Category 3: Fuel- and energy-related activities (not included in scope 1 or scope 2) | t-CO2 | 9,734 | 7,699 | 7,851 |
| Category 4: Upstream transportation and distribution | t-CO2 | 87,270 | 69,164 | 72,326 |
| Category 5: Waste generated in operations | t-CO2 | 4,588 | 5,648 | 5,774 |
| Category 6: Business travel | t-CO2 | 1,084 | 1,197 | 1,245 |
| Category 7: Employee commuting | t-CO2 | 2,352 | 2,595 | 2,699 |
| Category 8: Upstream leased assets | t-CO2 | 0 | 0 | 0 |
| Category 9: Downstream transportation and distribution | t-CO2 | 6,911 | 6,916 | 7,233 |
| Category 10: Processing of sold products | t-CO2 | 0 | 0 | 0 |
| Category 11: Use of sold products | t-CO2 | 154,796 | 139,649 | 130,042 |
| Category 12: End-of-life treatment of sold products | t-CO2 | 15,491 | 15,795 | 16,558 |
| Category 13: Downstream leased assets | t-CO2 | 0 | 0 | 0 |
| Category 14: Franchises | t-CO2 | 0 | 0 | 0 |
| Category 15: Investments | t-CO2 | 31 | 10 | 11 |
| Total emissions | t-CO2 | 587,575 | 564,191 | 581,743 |
Global Core Indicators
Quantitative assessment of natural capital as recommended by TNFD
| Indicator number | Factors of natural change | Measurement details | Unit | FY2024 |
|---|---|---|---|---|
| ― | Climate change | GHG Emissions Scope 1 | t-CO2 | 13,449 |
| GHG Emissions Scope 2 | t-CO2 | 6,183 | ||
| GHG Emissions Scope 3 | t-CO2 | 581,743 | ||
| C1.0 | Land use change | Total area managed by the Sysmex group (status of major facilities described in the annual securities report) | m2 | 401,621 |
| C2.1 | Pollution | Water Drainage | 1,000 m3 | 292 |
| C2.2 | Total Waste Emissions | t | 3,040 | |
| C2.3 | Recycling of containers and packaging materials and utilization rate of environmentally friendly materials | % | 62 | |
| C2.4 | PRTR emissions at domestic chemical sites | t | 0 | |
| C3.0 | Resource Use/Replenishment | Water withdrawals in water-stressed areas | 1,000 m3 | 97 |
Environmental Performance Data by Business Region
Quantitative assessment of dependency and impact